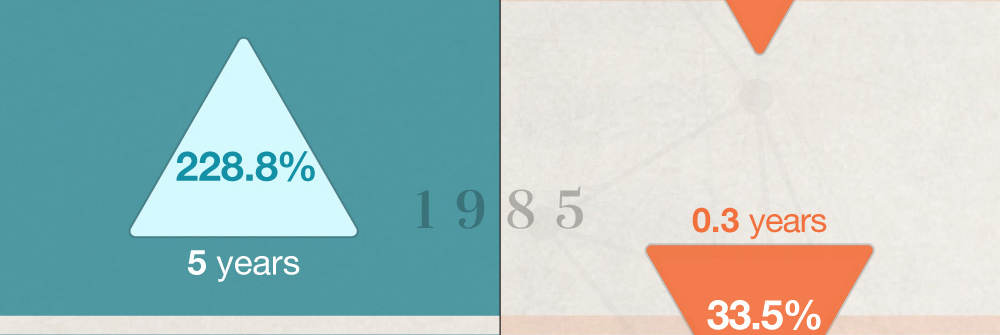
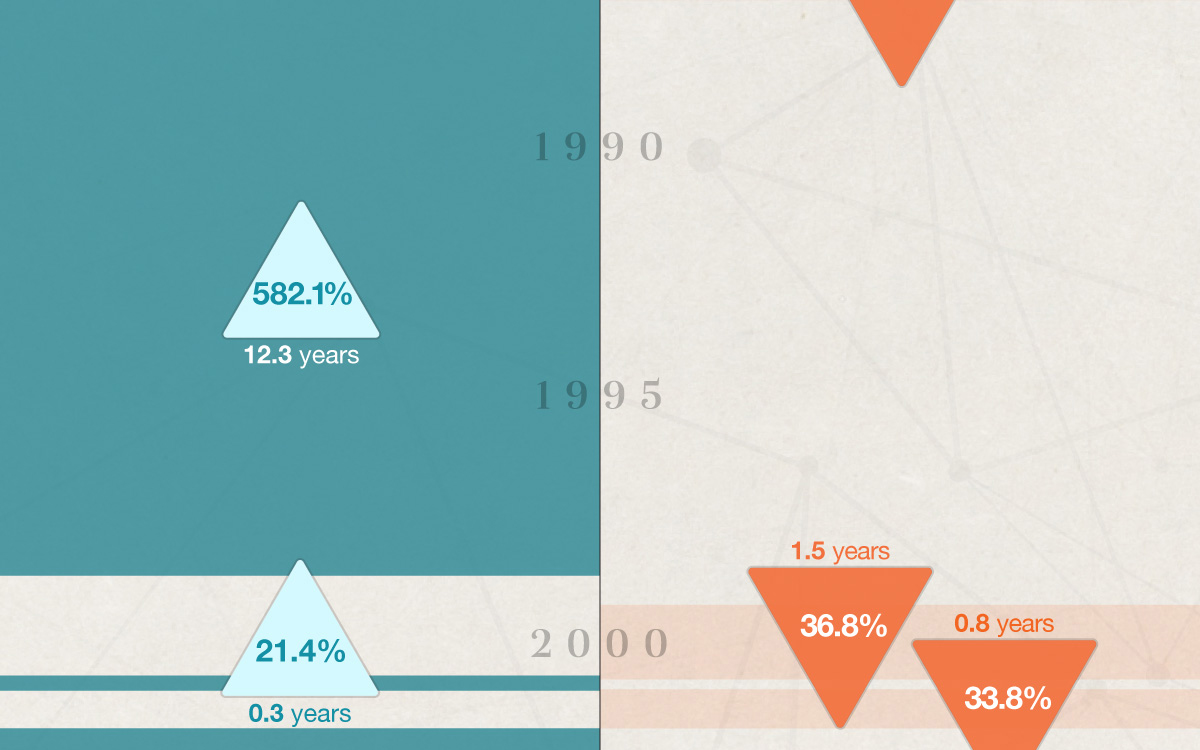
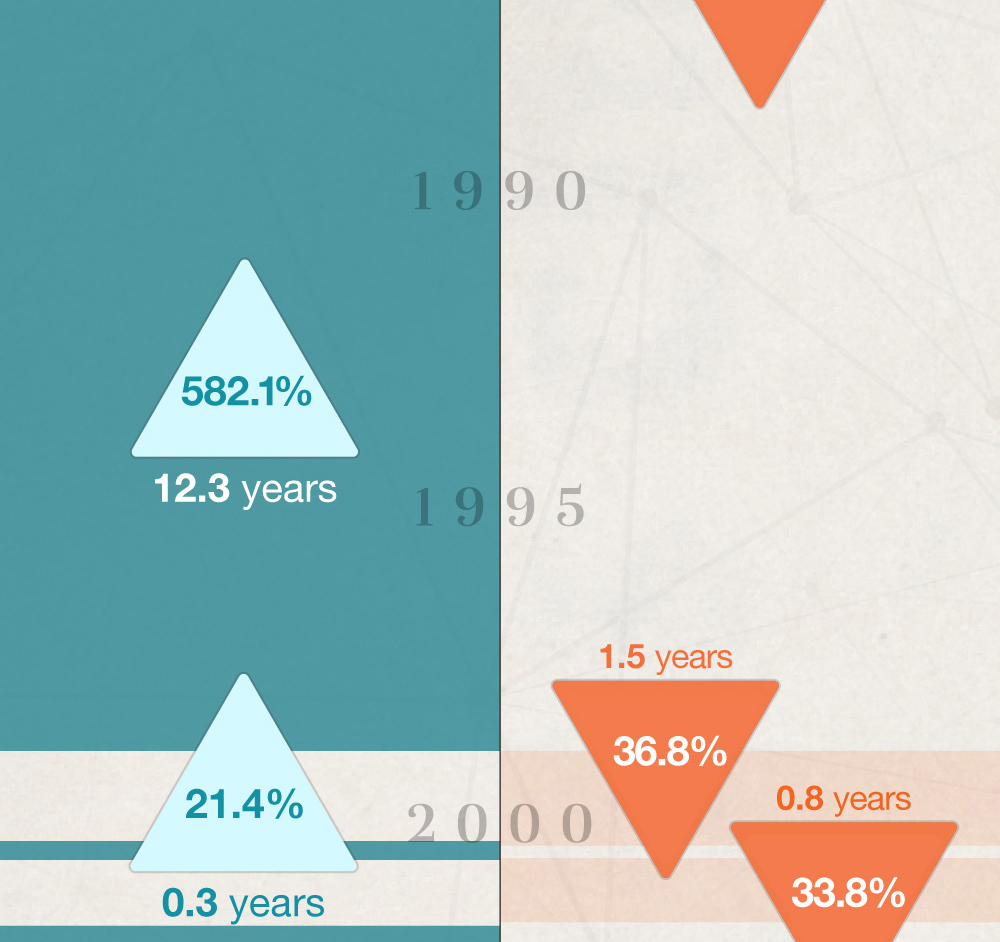
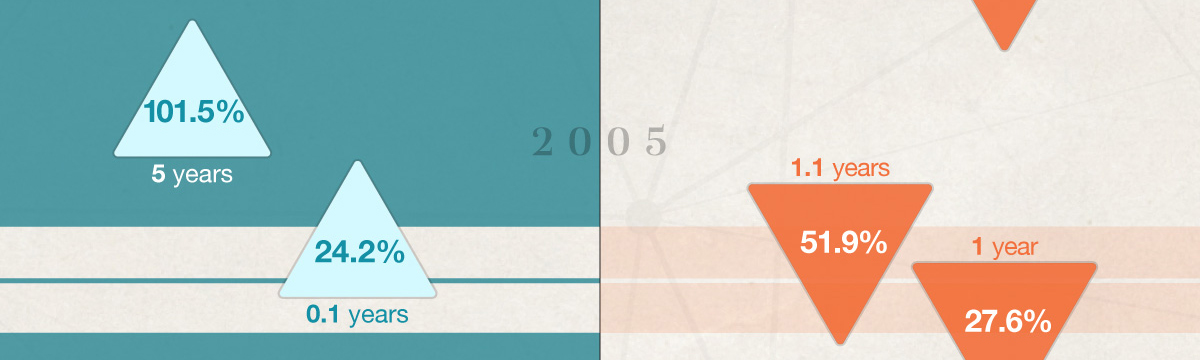
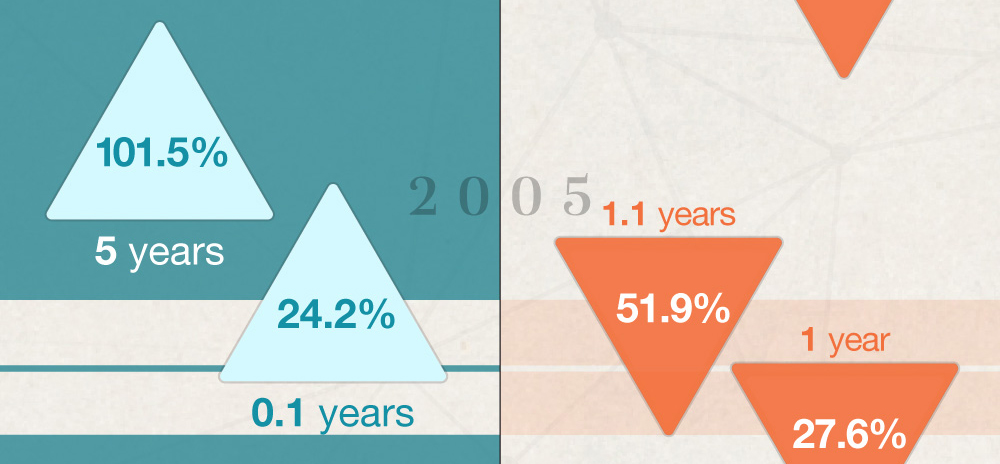
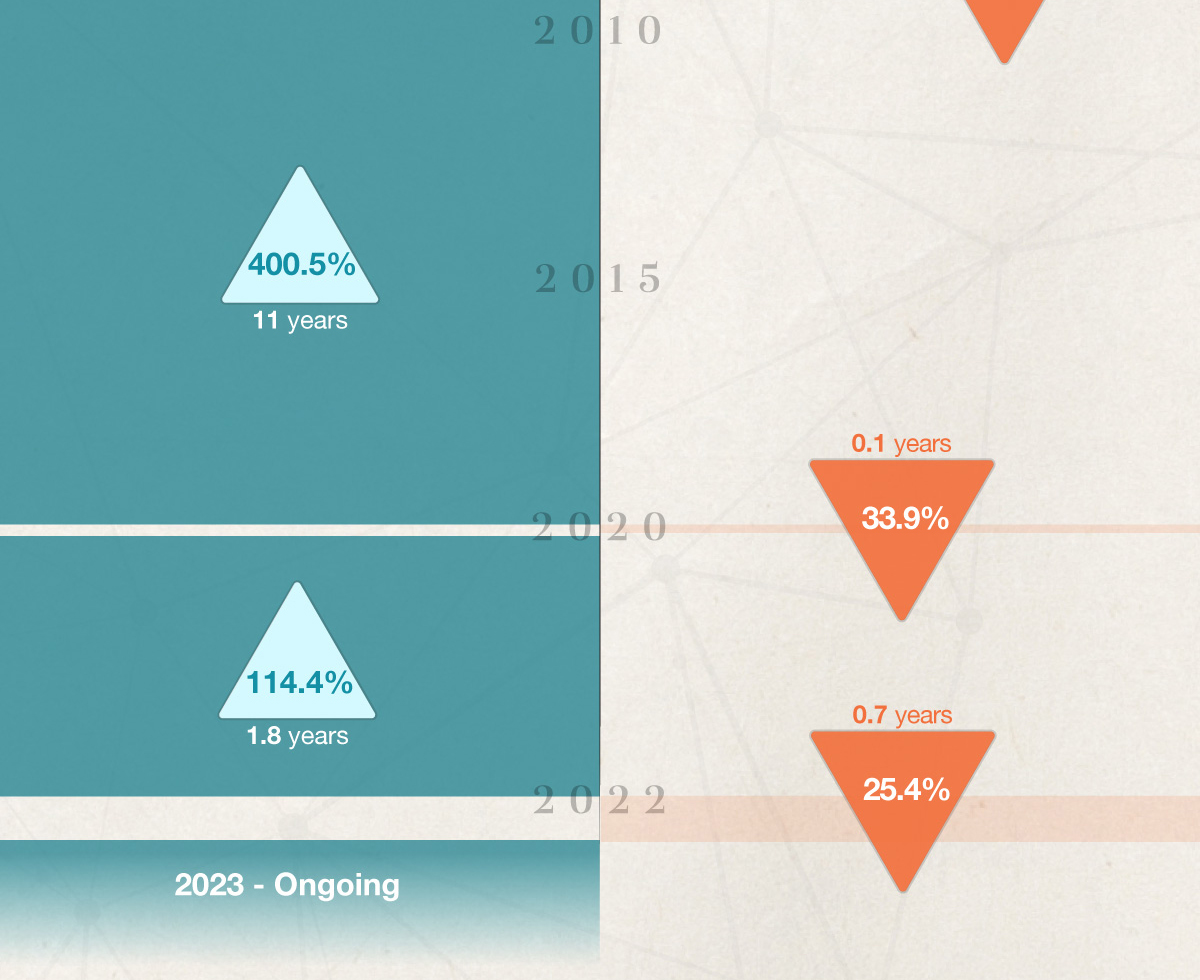
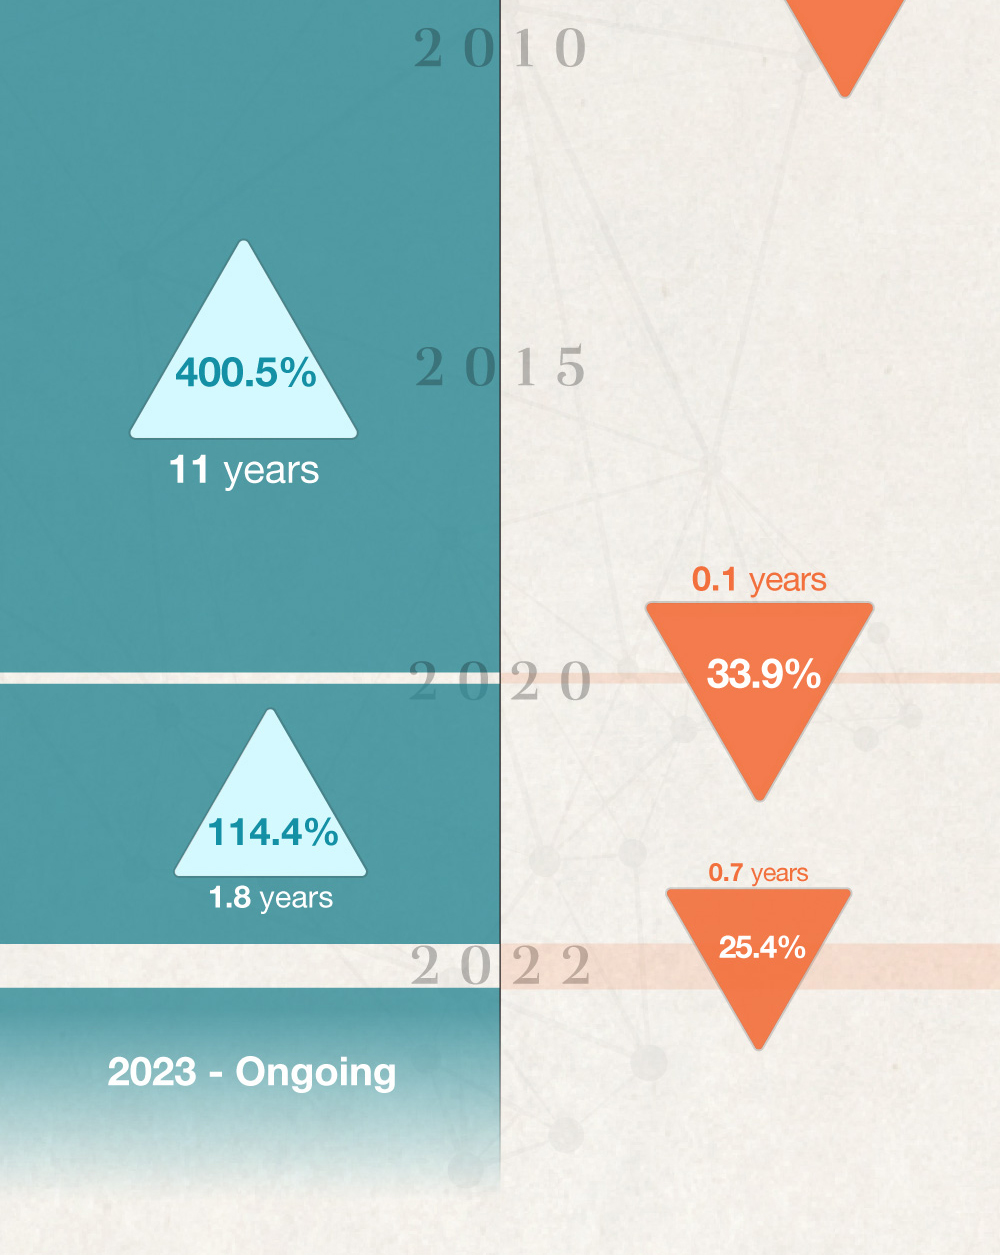
Bull & Bear Markets: A Timeline
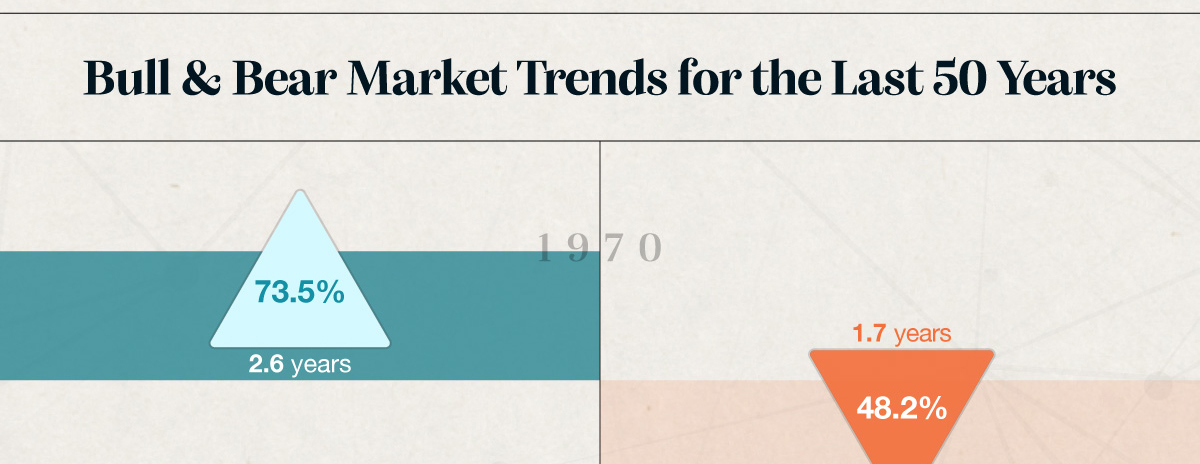
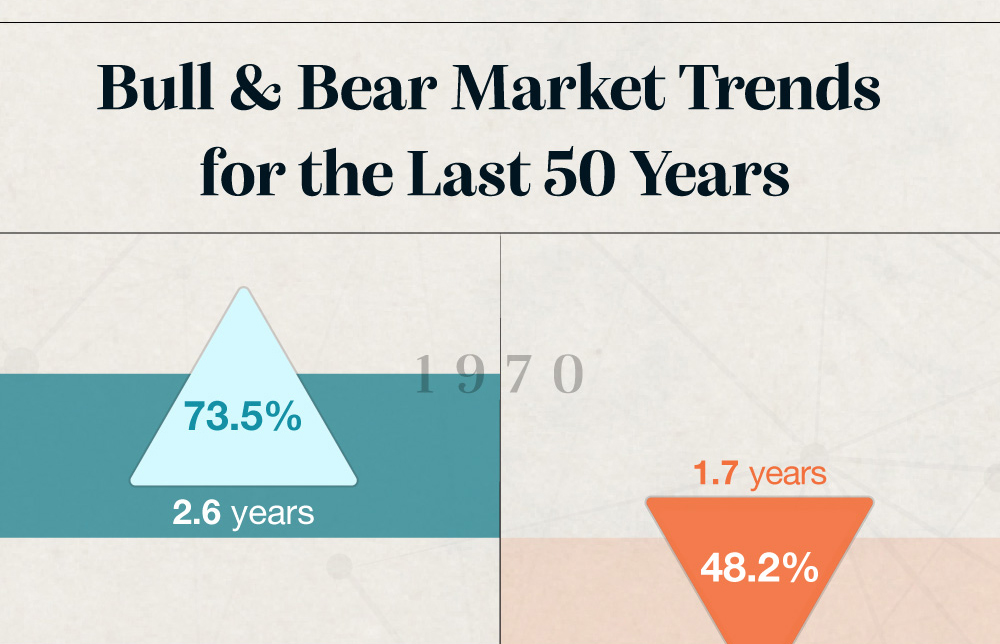
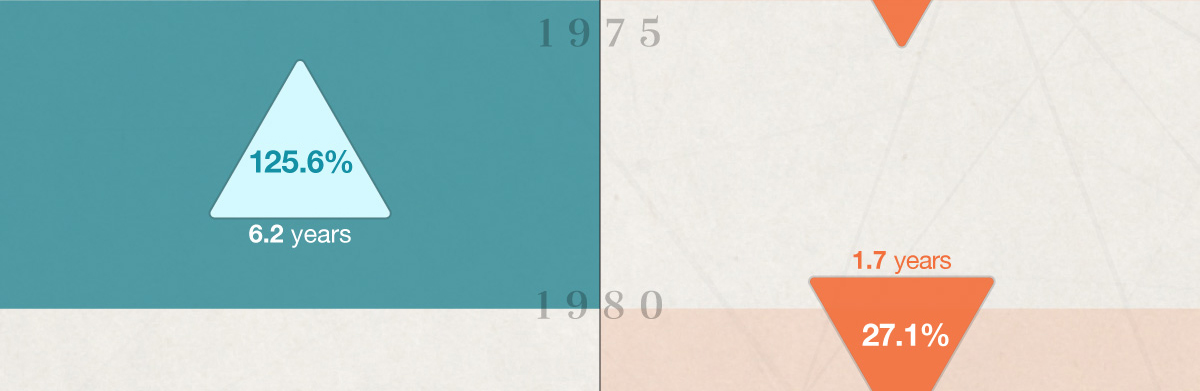
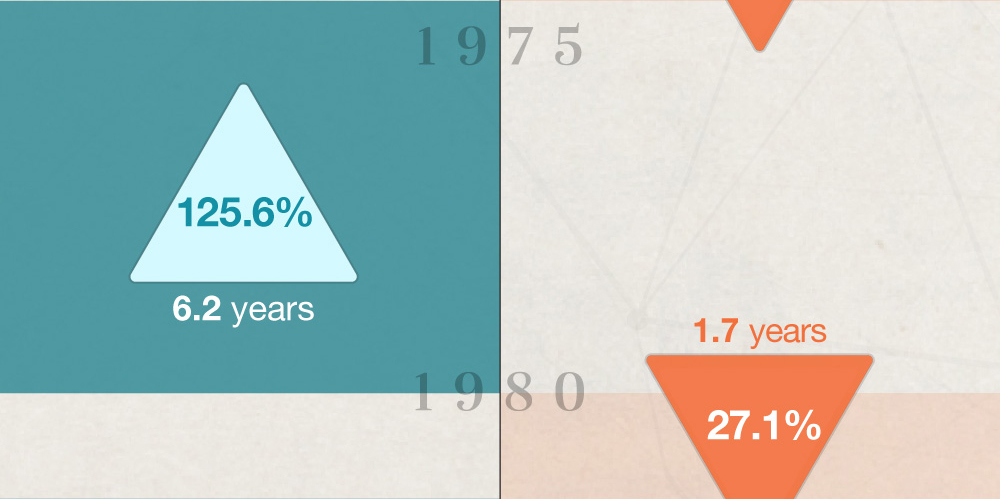


In the world of finance, the effects of the "confidence gap" can be especially apparent.

This worksheet can help you estimate the costs of a four-year college program.

Diversification is an investment principle designed to manage risk, but it can't prevent against a loss.
As a close-knit, multi-generational team with strong values and a broad range of skills, we welcome clients from all walks of life.
